About EAPs
Inundation Map Samples
Missouri Department of Natural Resources Maps
 These inundation maps were developed by the staff of the Water Resources
Center of the Missouri Department of Natural Resources (DNR).
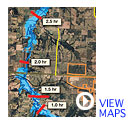
The dam, located outside the lower right area of Map 1, is
more than 40 feet high and holds back about 1,000 acre-feet of water
when the reservoir is full. The first map shows the length of time
before flood waters would reach various downstream points. A separate,
more detailed inundation map was drawn for each section of the stream.
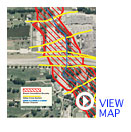
Maps 2 and 3 show the initial sections of the inundation zone
and vital information. This includes roads that would be overtopped,
arrival time of flood waters at key points, peak water elevation
time after the breach, flow of water expected and its depth.
LiDAR data was used to create the model for these inundation maps.
These inundation maps were developed by the staff of the Water Resources
Center of the Missouri Department of Natural Resources (DNR).
The dam, located outside the lower right area of Map 1, is
more than 40 feet high and holds back about 1,000 acre-feet of water
when the reservoir is full. The first map shows the length of time
before flood waters would reach various downstream points. A separate,
more detailed inundation map was drawn for each section of the stream.
Maps 2 and 3 show the initial sections of the inundation zone
and vital information. This includes roads that would be overtopped,
arrival time of flood waters at key points, peak water elevation
time after the breach, flow of water expected and its depth.
LiDAR data was used to create the model for these inundation maps.
A Typical Missouri EAP Inundation Map
 This
inundation map sample is one of four contiguous maps in the EAP for a typical Missouri HHP dam with parts of a community
within the inundation zone. The EAP was prepared according to
USDA Natural Resources Conservation Service (NRCS) guidelines.
U.S. Geological Survey quad maps were used as a basis for the maps
plus field surveys to arrive at the approximate inundation boundaries.
The impact area that could be flooded includes offices, a health
clinic, a house used for youth activities, an auto dealership,
city parks, and several residences, including 19 housing authority
units and more than a dozen homes.
This
inundation map sample is one of four contiguous maps in the EAP for a typical Missouri HHP dam with parts of a community
within the inundation zone. The EAP was prepared according to
USDA Natural Resources Conservation Service (NRCS) guidelines.
U.S. Geological Survey quad maps were used as a basis for the maps
plus field surveys to arrive at the approximate inundation boundaries.
The impact area that could be flooded includes offices, a health
clinic, a house used for youth activities, an auto dealership,
city parks, and several residences, including 19 housing authority
units and more than a dozen homes.
The blue dotted line running through the trees is the stream
channel below the dam. The red boundary lines and hatch marks
inside them indicate the potential inundation area if the dam
were to fail. The yellow lines intersecting the inundation
area identify river stage locations and correlate with floodwater
elevations expected at specific locations below the dam.
USDA/NRCS Map Example
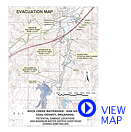 This
is an inundation map created by the USDA National Resources
Conservation Service as part of an example of what should be
included in a complete EAP for a
This
is an inundation map created by the USDA National Resources
Conservation Service as part of an example of what should be
included in a complete EAP for a
Taum Sauk Map
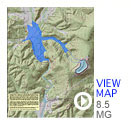 This
map shows the flooding that resulted from the
release of 1.5 billion gallons of water in December
2005 when there was a breach of the Taum Sauk
Upper Reservoir. Campgrounds and other facilities
at Johnson's Shut-Ins State Park were devastated. Because of
the time of year the only persons present were
a park ranger and his family, who suffered injuries.
Their home was destroyed. The map illustrates
how U.S. Geological Survey maps, geospatial data,
and LiDAR data can be used as the basis for inundation
mapping. Overlaying county assessor maps and
highway maps will reveal homes, businesses, structures,
and roadways at risk. The Missouri Department
of Natural Resources has posted an online
update on restoration of the park.
This
map shows the flooding that resulted from the
release of 1.5 billion gallons of water in December
2005 when there was a breach of the Taum Sauk
Upper Reservoir. Campgrounds and other facilities
at Johnson's Shut-Ins State Park were devastated. Because of
the time of year the only persons present were
a park ranger and his family, who suffered injuries.
Their home was destroyed. The map illustrates
how U.S. Geological Survey maps, geospatial data,
and LiDAR data can be used as the basis for inundation
mapping. Overlaying county assessor maps and
highway maps will reveal homes, businesses, structures,
and roadways at risk. The Missouri Department
of Natural Resources has posted an online
update on restoration of the park.